
York Region And South Simcoe Market Data
What The Local Market Is Showing In September 2026
The latest TRREB figures show a market with more choice than urgency in much of York Region and South Simcoe. That does not make every community or every property type the same. The useful question is what the local evidence means for the move in front of you.
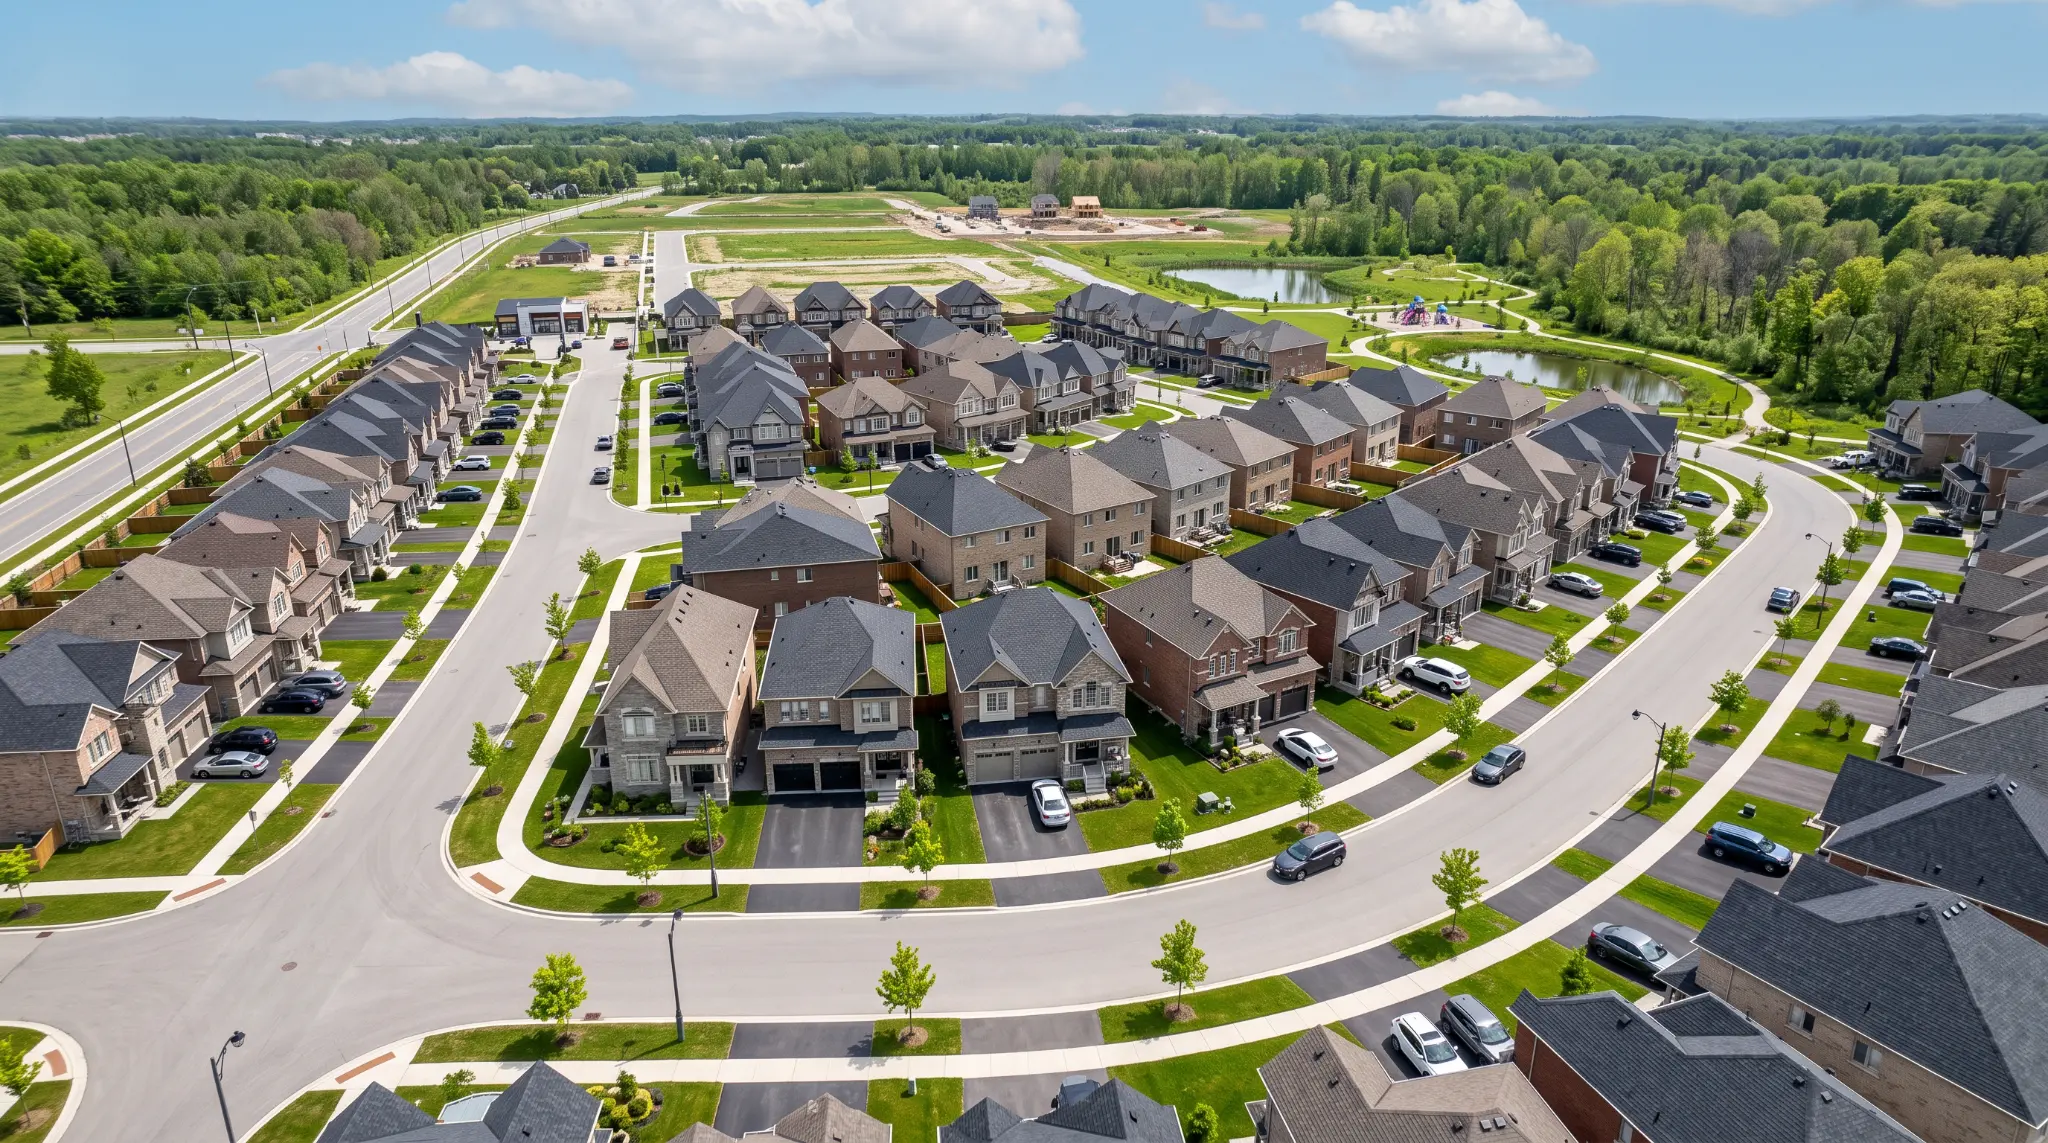
Latest report: September 2026 data, released October 6, 2026. This page uses the all home types tables in the official TRREB Market Watch release. Figures are reported for the month unless the table identifies a trend measure.
Read The Official TRREB Market Watch Release For September 2026
The Short Answer
September was not one uniform market. York Region recorded 893 sales at an average price of $1,136,650, with a 97% average sale to list price and 5.0 months of inventory on TRREB’s trend measure. Simcoe County recorded 187 sales at an average price of $810,453, with a 97% average sale to list price and 5.8 months of inventory on the same trend measure.
For a buyer, that generally means more room to compare homes and terms than a high urgency market would provide. For a seller, it means the comparison set and the preparation of the property matter. The regional figures are context, not a property valuation.
York Region Snapshot
This section uses the full September 2026 all home types table for York Region, including all nine municipalities reported by TRREB. Months of inventory and SNLR are TRREB trend measures, not a calculation from only September sales.
| Area | Sales | Average Price | Median Price | New Listings | SNLR Trend | Months Of Inventory Trend | Average SP/LP | Average LDOM |
|---|---|---|---|---|---|---|---|---|
| York Region | 893 | $1,136,650 | $1,043,000 | 3,106 | 35.8% | 5.0 | 97% | 38 days |
| Newmarket | 64 | $915,986 | $872,500 | 234 | 37.2% | 4.2 | 97% | 33 days |
| Aurora | 56 | $1,165,686 | $1,081,500 | 185 | 35.1% | 4.9 | 98% | 37 days |
| East Gwillimbury | 33 | $1,090,748 | $980,000 | 133 | 32.9% | 5.4 | 98% | 38 days |
| Georgina | 49 | $873,859 | $775,000 | 229 | 28.5% | 6.5 | 94% | 46 days |
| King | 20 | $1,875,750 | $1,710,000 | 111 | 21.8% | 11.4 | 94% | 42 days |
| Markham | 245 | $1,125,353 | $1,051,000 | 729 | 40.5% | 4.1 | 98% | 34 days |
| Richmond Hill | 172 | $1,189,203 | $1,079,000 | 584 | 33.3% | 5.6 | 98% | 36 days |
| Stouffville | 41 | $1,139,770 | $1,050,000 | 166 | 36.3% | 5.2 | 97% | 35 days |
| Vaughan | 213 | $1,163,441 | $1,080,000 | 735 | 37.2% | 4.9 | 97% | 42 days |
Source: Toronto Regional Real Estate Board, Market Watch September 2026, All Home Types, released October 6, 2026. SNLR means sales to new listings ratio and is reported as a trend measure. SP/LP means average sale price to list price. LDOM means average listing days on market. It can differ from total property time on market when a property is relisted.
South Simcoe Snapshot
South Simcoe shows a different pattern from York Region. The local figures below are presented separately so they are not lost inside a regional average.
| Area | Sales | Average Price | Median Price | New Listings | SNLR Trend | Months Of Inventory Trend | Average SP/LP | Average LDOM |
|---|---|---|---|---|---|---|---|---|
| TRREB Reported Simcoe County Activity | 187 | $810,453 | $762,500 | 566 | 33.8% | 5.8 | 97% | 44 days |
| Bradford | 44 | $913,635 | $895,000 | 99 | 41.6% | 4.4 | 98% | 35 days |
| Innisfil | 56 | $747,652 | $707,500 | 211 | 27.1% | 7.3 | 97% | 44 days |
| New Tecumseth | 54 | $807,218 | $767,500 | 129 | 39.0% | 5.2 | 96% | 53 days |
Source: Toronto Regional Real Estate Board, Market Watch September 2026, All Home Types, released October 6, 2026. The Simcoe County row reflects TRREB reported Simcoe County activity, which is broader than South Simcoe. It is shown for context and is not a South Simcoe only total. SNLR means sales to new listings ratio and is reported as a trend measure. SP/LP means average sale price to list price. LDOM means average listing days on market. It can differ from total property time on market when a property is relisted. Barrie is not included in the community rows because a matching official September Simcoe source was not verified for this page.
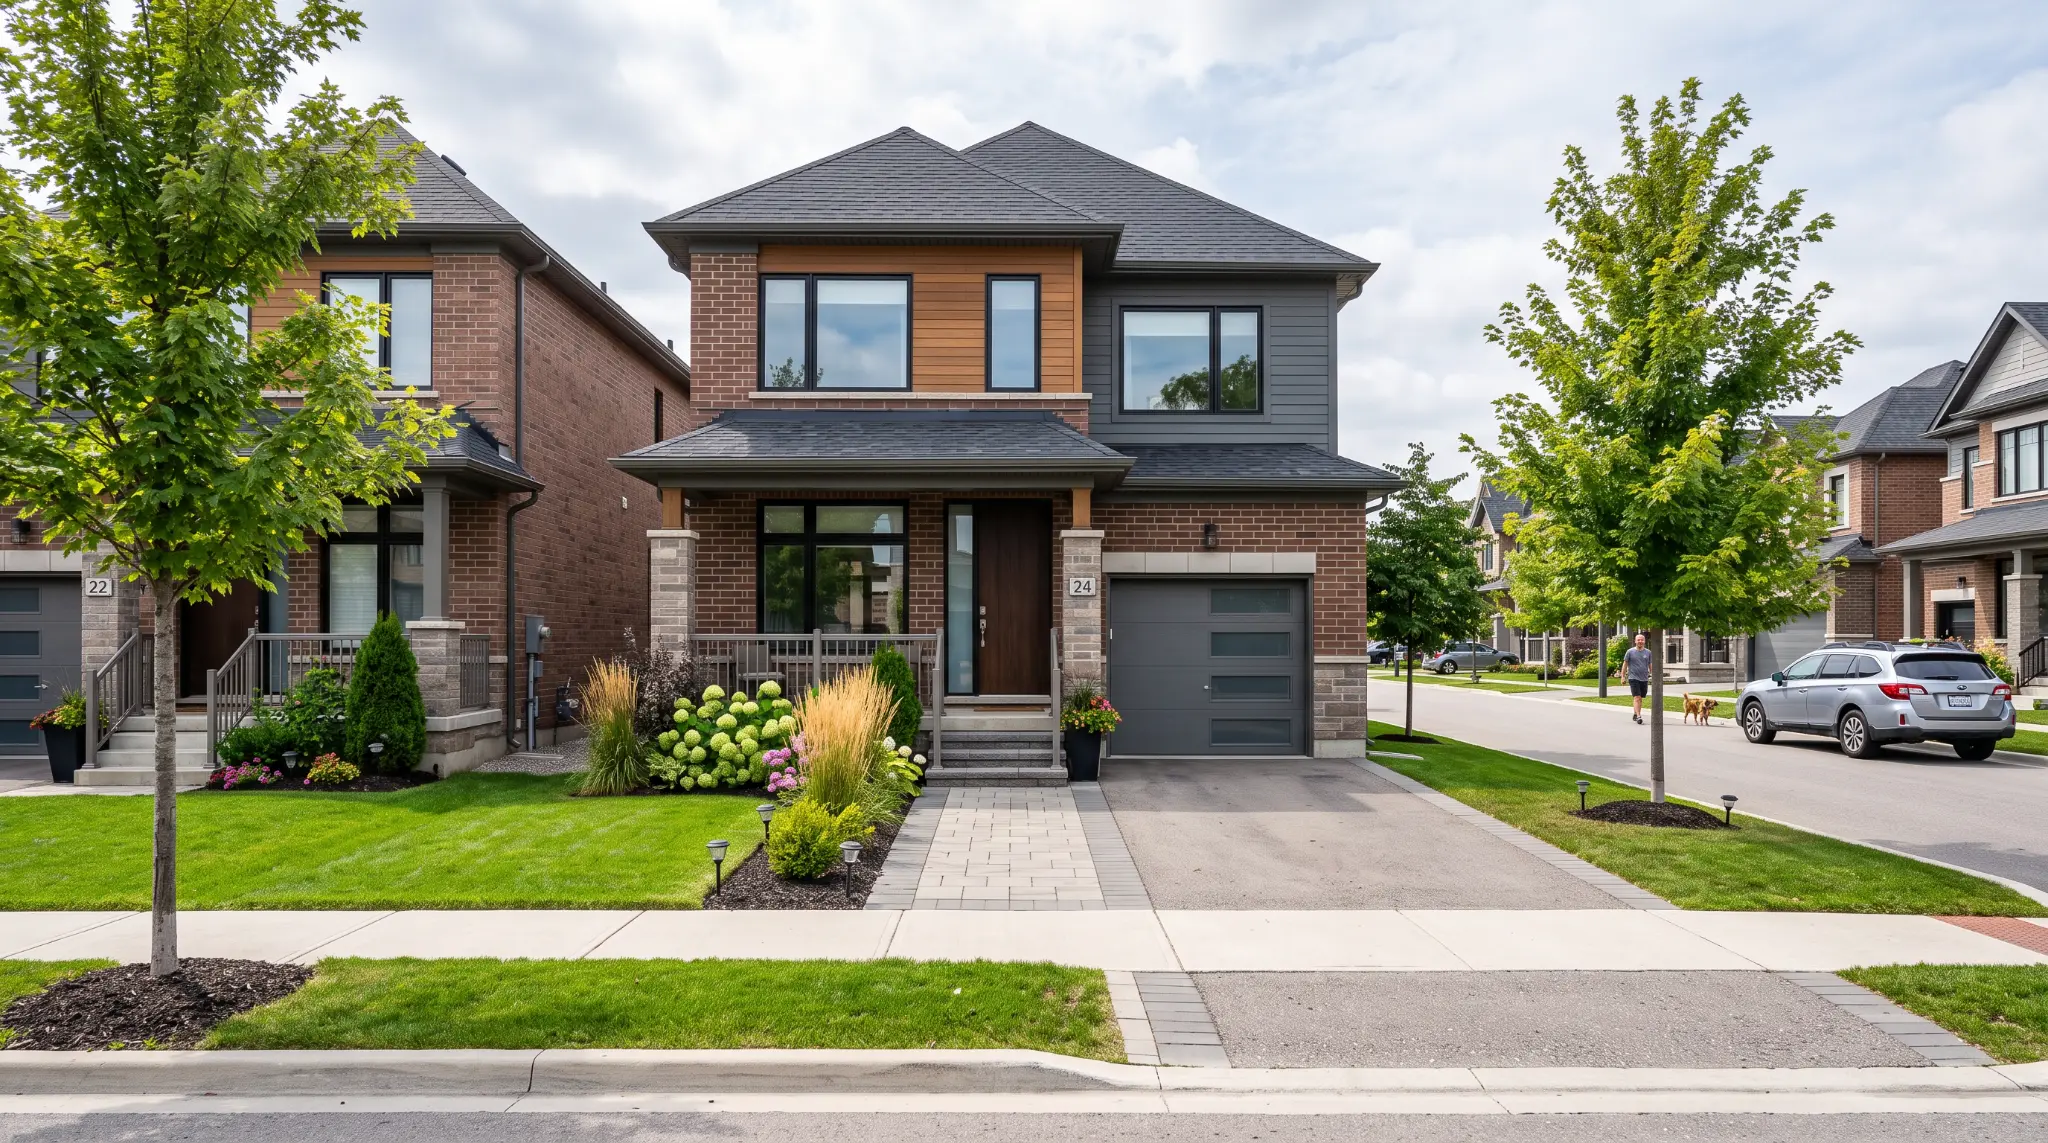
What This Means For Buyers
There is a meaningful difference between having choice and having certainty. A lower SNLR trend and more months of inventory can create room to compare the home, the competing listings, the condition, and the terms. It does not remove the need to understand financing, inspection, insurance, or legal questions with the professionals chosen for those matters.
For a first-time buyer, the useful next question is not simply whether a community is cheaper. It is whether the home type, monthly responsibilities, commute, and likely repair questions fit the household’s ordinary week.
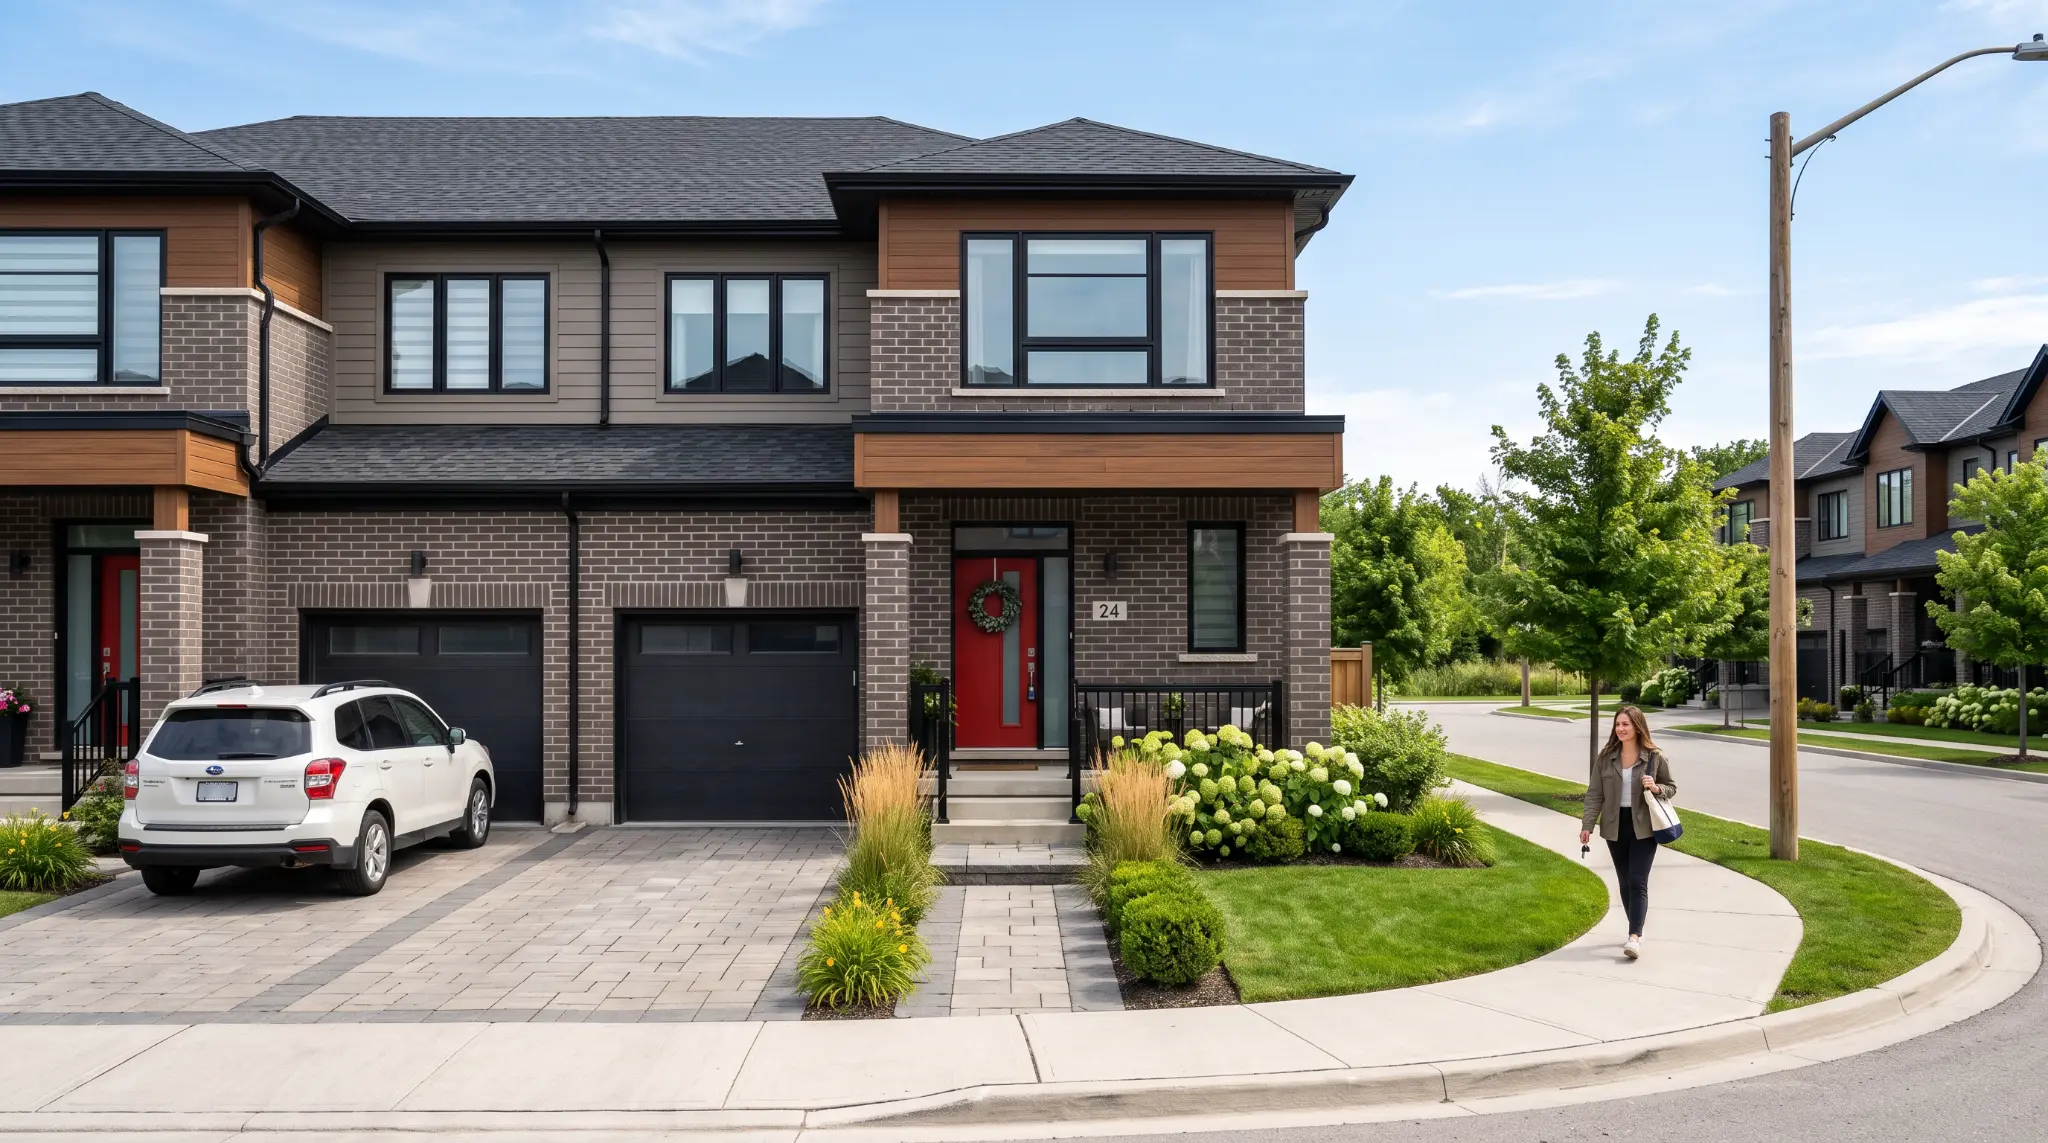
What This Means For Sellers
A 97% or 98% average sale to list price does not tell you what one home should be listed at. It tells you that the comparison set, condition, presentation, and pricing strategy still matter. A property that is positioned against the wrong alternatives can receive a very different response from one positioned against the homes buyers are actually weighing.
Before recommending a list price, I would want to look at recent sales, current competition, listing history, property type, lot and layout, visible condition, and the response to comparable homes.
Where The Leverage Looks Different
Bradford Is Closer To Balanced
Bradford’s September SNLR trend was 41.6%, with 4.4 months of inventory and an average 98% sale to list price. Under the working interpretation used on this page, that is closer to balanced than the other South Simcoe communities shown here. It does not mean every Bradford property will receive the same response.
Innisfil Has More Buyer Choice
Innisfil recorded a 27.1% SNLR trend, 7.3 months of inventory, and an average 44 days on market. That points to more available choice and more time for comparison than Bradford’s September pattern. Property type and location still matter.
Newmarket And Aurora Are Not Interchangeable
Newmarket’s average price was $915,986 and Aurora’s was $1,165,686 in September. Their sales volume, inventory trend, and days on market also differed. A regional average cannot answer which community fits a particular household.
New Tecumseth Needs A Closer Look
New Tecumseth recorded 53 average listing days, the longest figure in this snapshot, with a 39.0% SNLR trend and 5.2 months of inventory. That may create a different conversation for a seller than the headline average price alone suggests.
The labels on this scorecard are Pam’s working interpretation of the TRREB trend measures. They are not TRREB classifications and should not be treated as a guarantee of negotiation results.
What The Numbers Do Not Tell You
Community figures are useful for direction. They do not establish the value of a particular home, the result of a future listing, the condition of a property, or the terms a buyer should accept.
Average and median prices can move when the mix of homes sold changes. Small monthly samples can produce large swings. SNLR and months of inventory in this report are trend measures supplied by TRREB, while the sales, listings, prices, SP/LP, and days on market are the September table figures. Those measures answer different questions.
That is why I use the report as a starting point, then look more closely at the property type, competing listings, recent sales, listing history, and the practical priorities of the household.
Questions To Carry Into A Real Decision
For A First-Time Buyer
Which communities and home types fit the way you actually live, and what should be confirmed before you compare prices?
For A Move-Up Household
Does the price gap between the home you would sell and the home you would buy behave differently in each community and property type?
For A Seller
Which competing homes will buyers compare with yours, and what deserves attention before the property is positioned?
For A Downsizer
What does the move need to accomplish, and which housing choices support the next stage without creating a new problem?
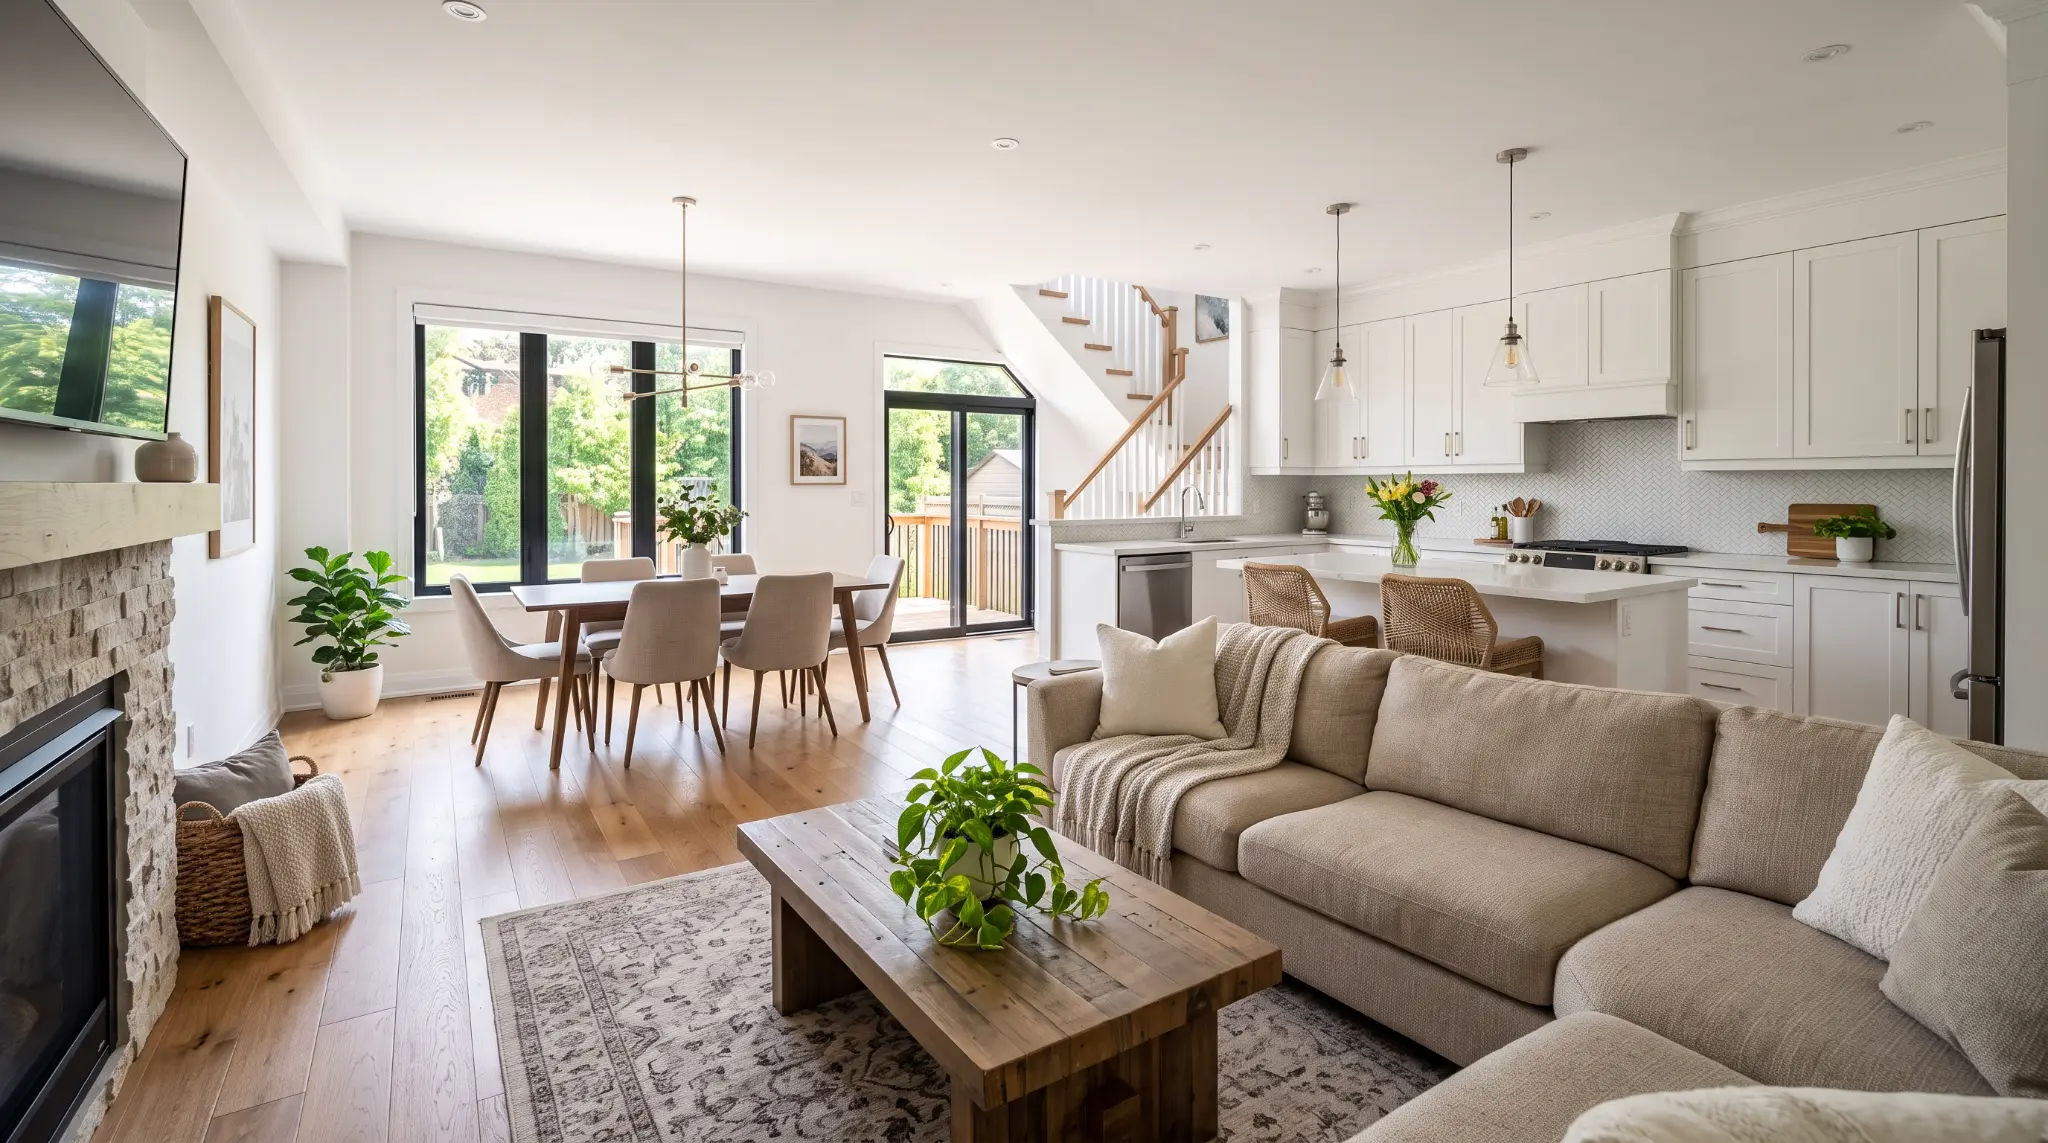
Monthly Market Report Archive
September 2026
September 2026 data, released October 6, 2026. All home types. York Region and South Simcoe communities shown above.
Prepared by Pam Bechard, REALTOR®, Royal LePage RCR Realty, Brokerage. Market figures are from the official TRREB September 2026 Market Watch release. This report is general market information and is not a property valuation or financial, legal, mortgage, tax, insurance, or inspection advice.