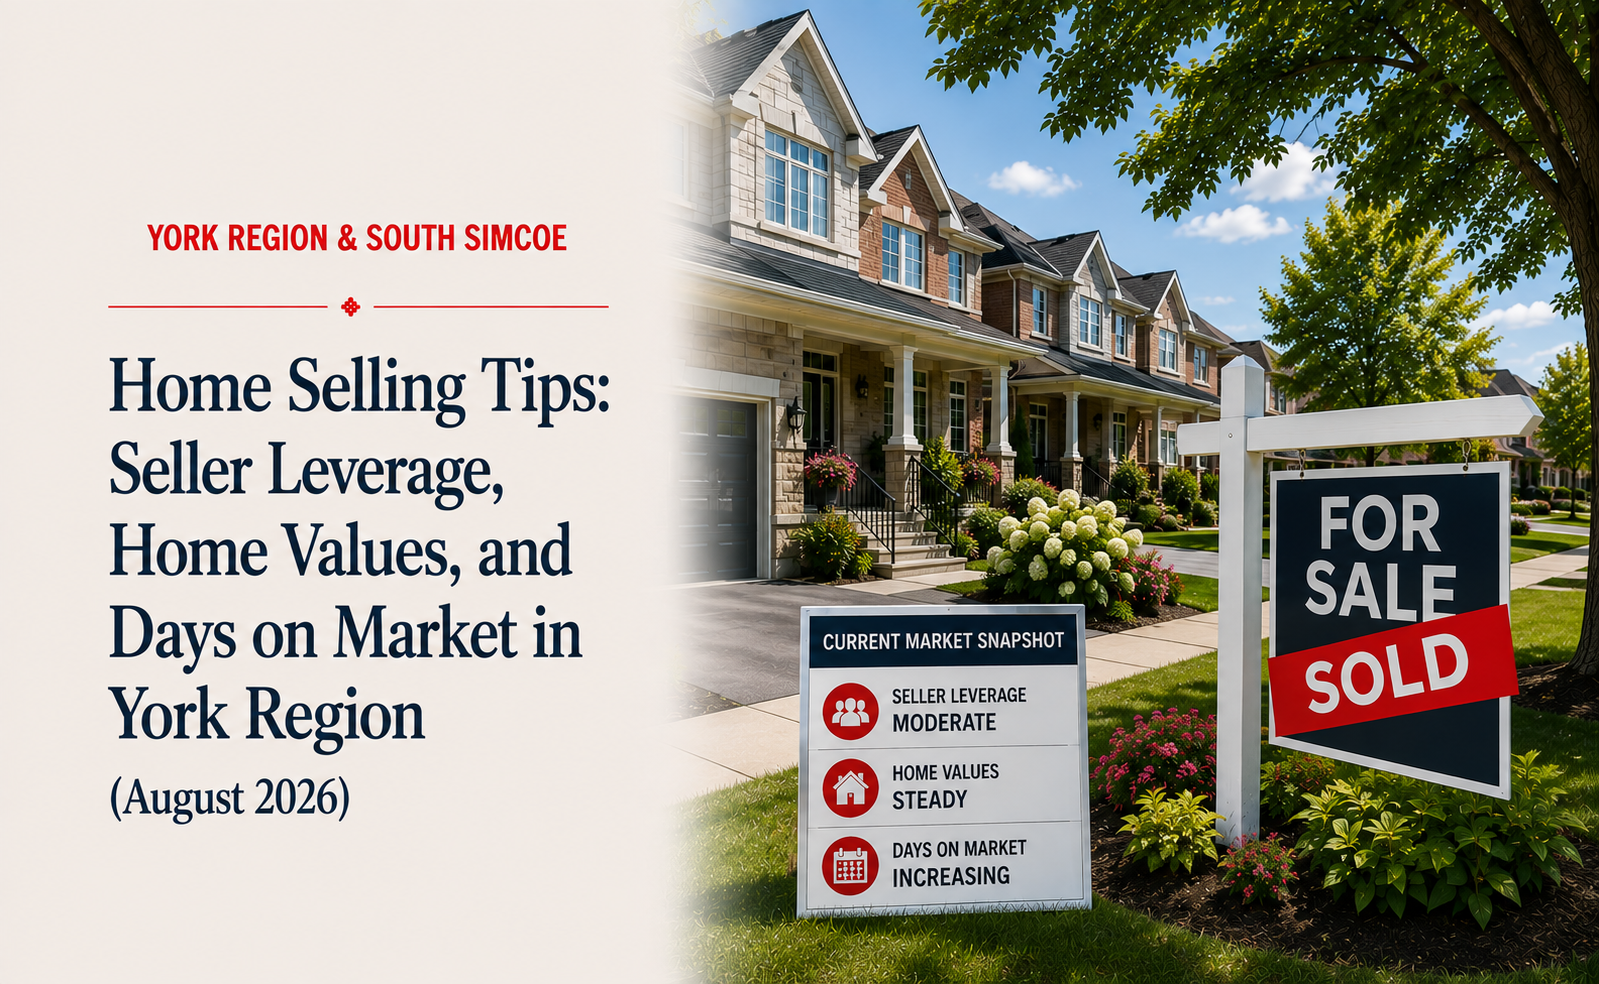
Home Selling Tips: Seller Leverage, Home Values, and Days on Market in York Region (August 2026)
Based on July 2026 TRREB data, York Region and South Simcoe conditions vary by community, property type, price range, and the homes buyers can choose today. A well-priced property can still attract serious interest, but sellers need to distinguish a general regional statistic from the evidence that applies to their own home.
This Q&A answers the seller questions that come up most often after the decision to list. For the timing question itself, see Should You List Your York Region or South Simcoe Home Now or Wait for Fall 2026?.
York Region and South Simcoe Seller Questions Answered
How much leverage do sellers have right now in York Region and South Simcoe?
Based on July 2026 TRREB data, York Region recorded 5.0 months of inventory and an average sale-to-list ratio of 98%. That is a balanced, price-sensitive setting rather than a blanket seller or buyer market.
Conditions can look very different by community, home type, and price range. Well-priced entry-level homes may attract stronger demand, while higher-priced detached homes can face more active alternatives and more negotiation. Review current competing listings and recent local sales before setting an individual property strategy.
Is the York Region market slowing down or picking up?
July did not produce one simple answer for every seller. York Region saw 1,063 sales, 2,764 new listings, and 5,179 active listings in July 2026. That means buyers were active, but they had enough choice to compare value carefully.
Across the broader Simcoe County July report, there were 6.3 months of inventory and a 96% average sale-to-list ratio. Simcoe County includes areas beyond South Simcoe, so treat it as broader regional context rather than a figure for any one town. For the current local picture, see the July 2026 York Region and South Simcoe market update.
What is my home worth in today’s market?
Your home’s likely value range is shaped by recent comparable sales, current active competition, and the details buyers can see when they compare your property with alternatives: condition, layout, lot, location, upgrades, and total carrying costs.
Town-wide average prices are not individual home values. Online estimates can be a starting point, but they cannot fully account for your property’s specific condition or the active homes competing for the same buyer. Read why different websites show different home prices before comparing figures from different sources.
If you are considering a sale, a current comparative market analysis can estimate a realistic value range using recent comparable sales, active competition, and your home’s condition and location. Request a focused pricing review.
How long will my home take to sell in August?
In July 2026, the average listing period was 34 days in York Region and 39 days across Simcoe County, according to official TRREB reports. Individual results can be faster or slower depending on price, property type, location, condition, and competing inventory.
Instead of treating a regional average as a deadline, compare your listing with the homes buyers can tour today and the homes that have recently sold in the same price range. If response is weaker than direct competitors, use the evidence to assess price, presentation, and buyer fit. For a detailed checklist, read Why Is My York Region or South Simcoe Home Not Selling?.
If I list now, should I expect to sell below asking price?
Selling below asking is possible, but it is not automatic. The July 2026 regional average sale-to-list ratio was approximately 98% in York Region and 96% in Simcoe County. Your likely result depends on whether the initial list price is credible against the homes buyers can compare today.
Transparent pricing, clear presentation, and a strategy built around current competition are generally more reliable than assuming an underpriced listing will create a bidding war.
Why do different websites show different home prices for the same town?
Different websites can use different reporting periods, geographic boundaries, property-type mixes, and definitions of price. TRREB monthly figures summarize completed MLS® sales for a defined reporting period, while portal sites may display frequently updated estimates or recent-period figures using their own methodology.
Both can be useful, but they are not interchangeable. Before drawing a conclusion, check what the number measures, when it was calculated, the area it includes, and whether it reflects sold prices, asking prices, an estimate, or a specific property type.
Which home-price figure should I trust: TRREB or an online estimate?
Use the figure that fits the question. A clearly dated TRREB report is useful for tracking monthly or year-over-year market trends when you compare the same geography, property type, and reporting period. An online estimate can be useful for a rough orientation, but it is not an appraisal or a recommended list price.
For a sale or purchase decision, recent comparable sales and active competition in the relevant neighbourhood and price range matter more than any one town-wide figure.
Sources and Methodology
Last updated: August 2026. York Region figures in this article are from TRREB’s July 2026 Market Watch. Simcoe County figures are from TRREB’s July 2026 Simcoe County report. Simcoe County is broader than South Simcoe, so its figures should not be treated as a specific forecast or valuation for any individual community or property.
What to Do Next
If you are weighing a late-summer or fall sale, begin with the evidence for your specific home: recent comparable sales, current competition, presentation, and your timing. Then use that information to decide whether to list now, prepare further, or adjust the strategy.
- Read the guide to listing now or waiting for fall
- Read the July market report
- Request a focused pricing review
- Book a 15-minute strategy call to discuss your timing and options.